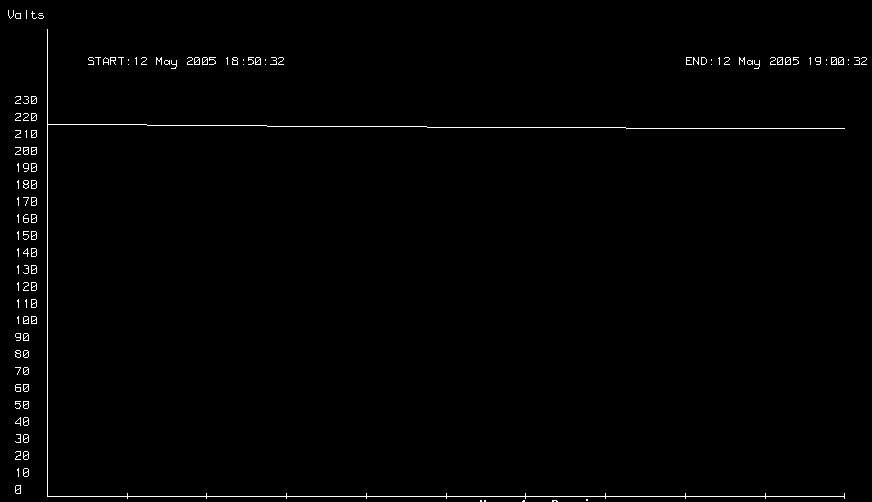
Below are the data taken during a number of test I ran on 12 through 15 May 2005. Unless noted otherwise, the test conditions were:
At this point, the outlet strip has a nominal 220V. Loads were set as described for each test.

The first test is just to establish a baseline. I ran the voltmeter only (no external load) for 10 minutes to watch the battery voltage. In this short period there was hardly any change in battery voltage.
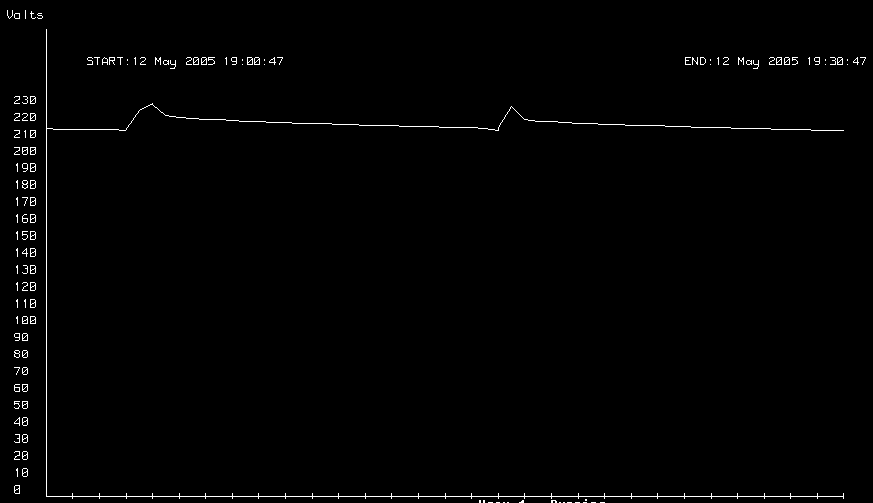
In this test I gingerly turned on the 50 watt load. Gingerly because this is the first time I drew power directly from the battery. Since this is 30 minutes (different horizontal scale from test above) you can see the voltage decay to the point that the gasoline engine starts up and recharges the battery briefly.
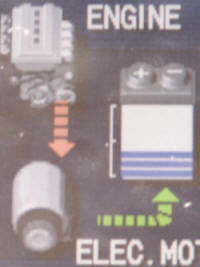
During this test I noticed what I thought might be an anomaly. While looking at the voltage bars on the Prius energy display, I was concerned that the battery was re-charging to a lower point each time. I.e., there were fewer and fewer bars lit. I was concerned that the car was recharging the battery based on its calculated load rather than the measured load. (My experimental load does contribute to the current sensor reading, but is obviously not automatically calculated by the vehicle computer, which doesn't have control over it.) I decided to discontinue testing for the day to review the numerical data and to confirm that the battery would recharge normally when driving the car.
After reviewing the results I decided that the bar indication I was concerned about was probably normal, but that I could test it safely by using the air conditioner, which is electric, as a load. I expected the A/C to discharge the battery quickly, and thus cause a fairly rapid cycling of the engine to recharge the battery. But...
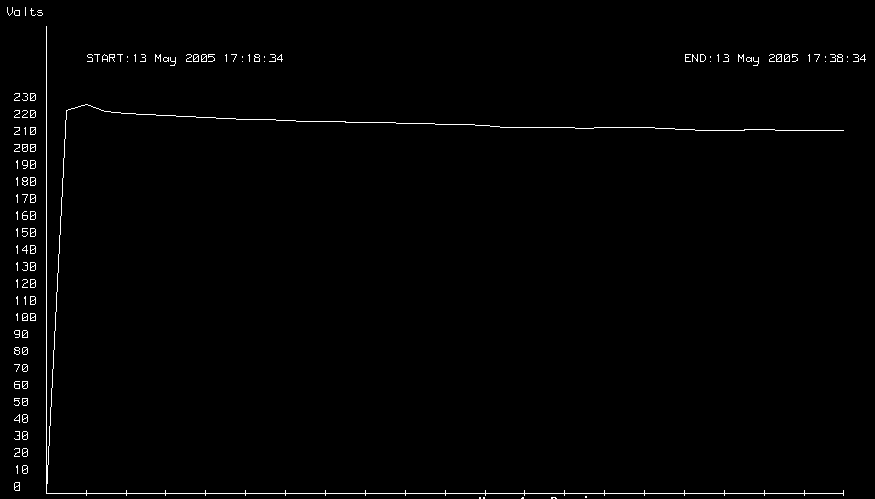
To my surprise, after turning on the car and the A/C and waiting 20 minutes, I found that the A/C was still running on the initial charge (from normal driving) of the HV battery. Since the battery did seem to be discharging according to plan, I restarted the test and ran it for another 40 minutes. Unfortunately the computer crashed ("PCs," he cursed) most of the way through the test, so I took a photo of the screen.
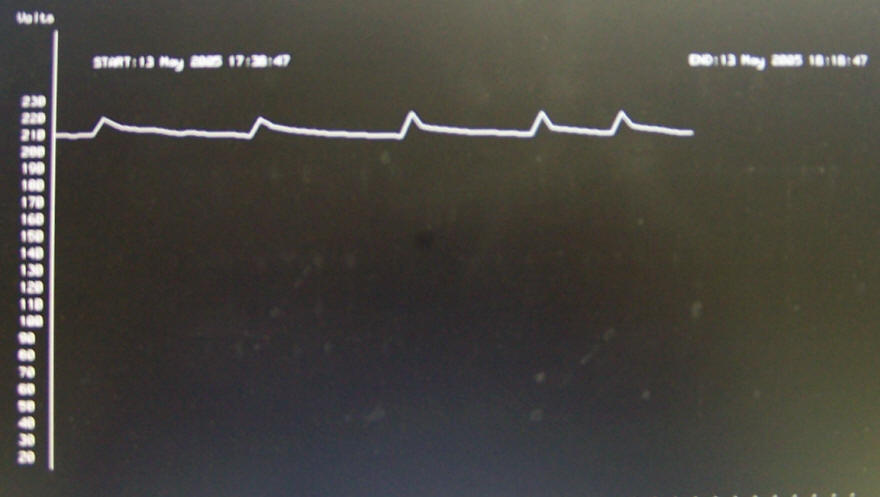
As you can see, the A/C makes a fine test load. As you can't see, the bars on the display showed the same characteristics that concerned me in previous tests. Since these test were completely normal operation for the car - I was doing nothing but measuring HV battery voltage - I concluded that the discharge/charge cycle I observed under load test was not a problem, and that it was OK to proceed with the load tests.
What one would expect to see, assuming everything was working correctly, would be periodic humps in the battery voltage curve followed by a slow discharge until it humps again. As the power drawn from the battery is increased, the humps should get closer together. Depending on how "smart" the charging algorithm is, one might see differences in the charge characteristics as well, e.g., if the discharge rate is rapid, the charger might decide to dump more energy into the battery as a precaution. If the charger isn't sophisticated, i.e., if it simply turns on when the battery voltage goes below a certain point and off when it goes above, there would still be some change due to the external load, but it wouldn't be terribly pronounced. Finally, the absolute DC level of both the charge and discharge should decrease with increasing load. This would be in part a measurement artifact - the load and the instruments are at the end of a cable that has a certain amount of resistance.
Emboldened by the test with the air conditioner, I proceeded to run tests with higher external loads.
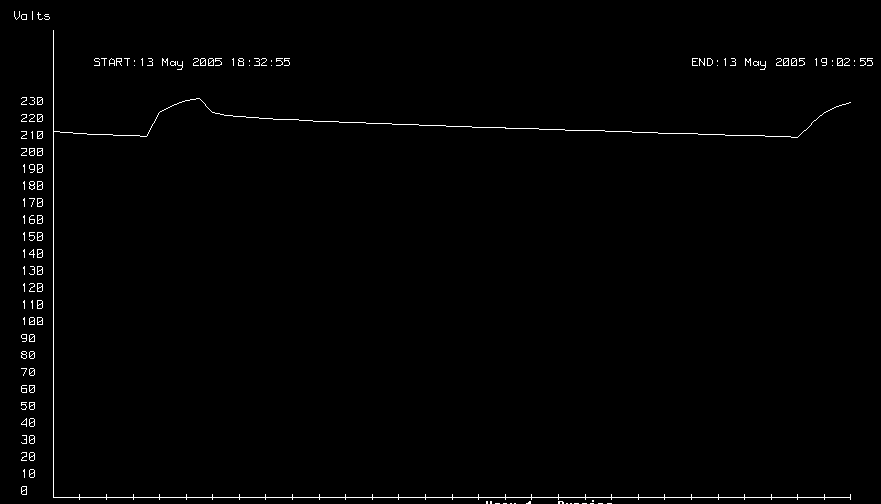
200 Watt load, 1/2 hour.
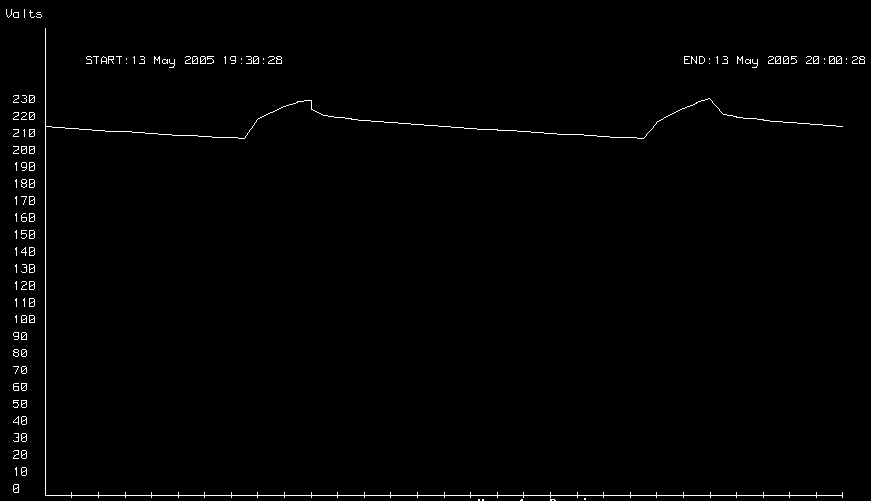
400 Watt load, 1/2 hour.
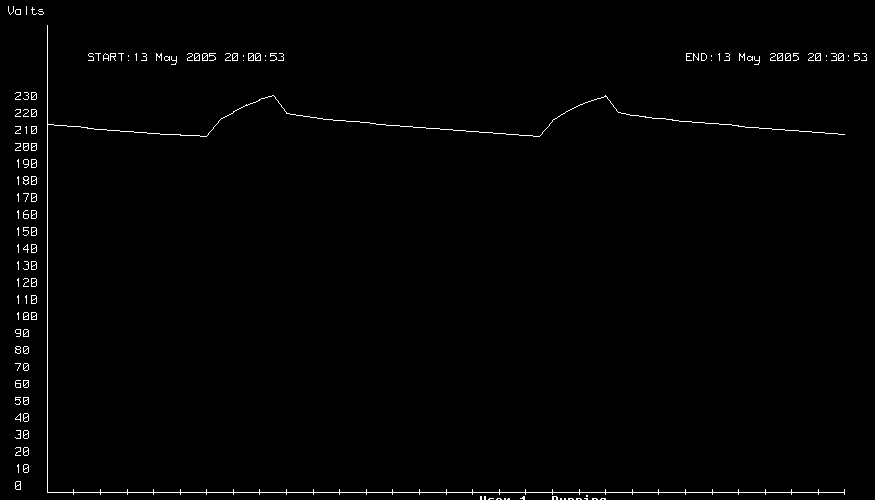
800 Watt load, 1/2 hour
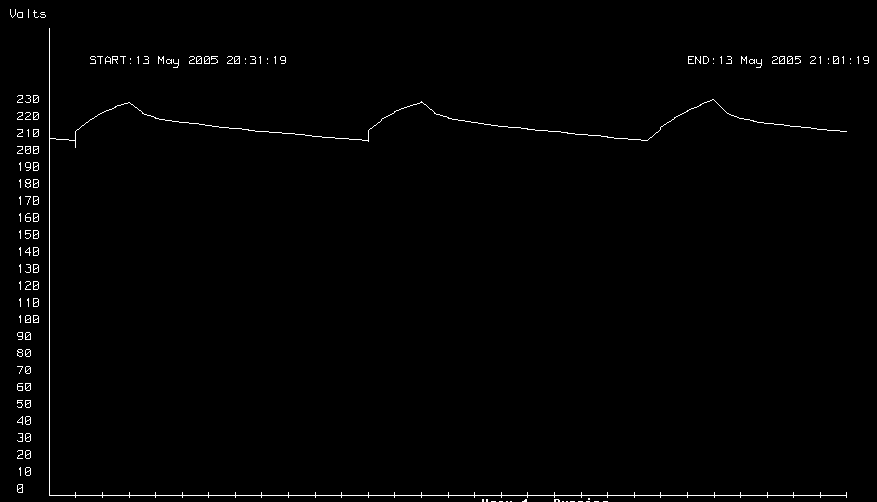
1KW load, 1/2 hour.
Here I stopped for the day. To continue raising the power level I had to purchase additional lamps for the dummy load and arrange for a cooling fan, since the KW load was starting to heat the test cart unacceptably. (And I should probably have gotten some shades.)
OK. Another bunch of 200W bulbs installed in the dummy load. Since the HV battery was fully charged from driving, I set this test to run for 40 minutes.
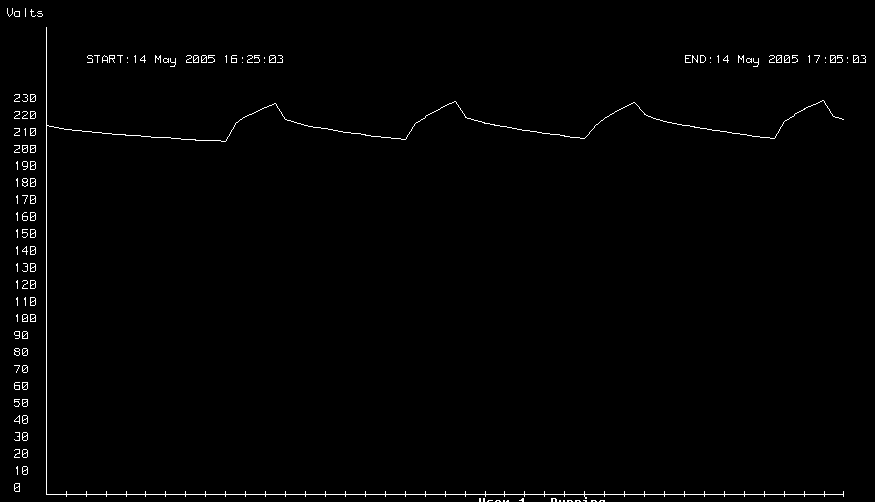
1400W load, 40 minutes.
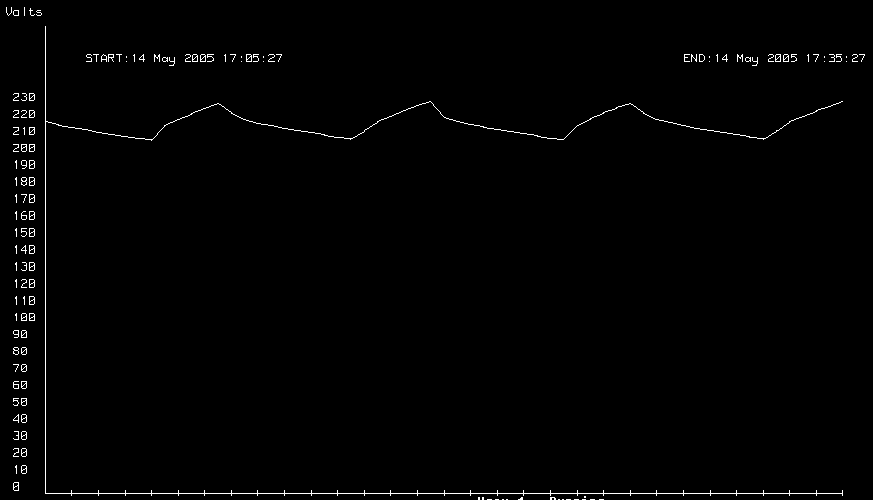
2KW load, 30 minutes. With this test I started taking notes on the Prius engine duty cycle, which began to be significant. In this case, I took the following data points:
OFF 17:20:37, ON 17:25:38, OFF 17:28:21, ON 17:33:23, OFF 17:36:05
I'll analyze the significance of these numbers in the test summary.
The next and final test is again a photo due to a computer crash midway through. The test actually made it to the full 30 minutes but I didn't notice the lack of data 'til after that.
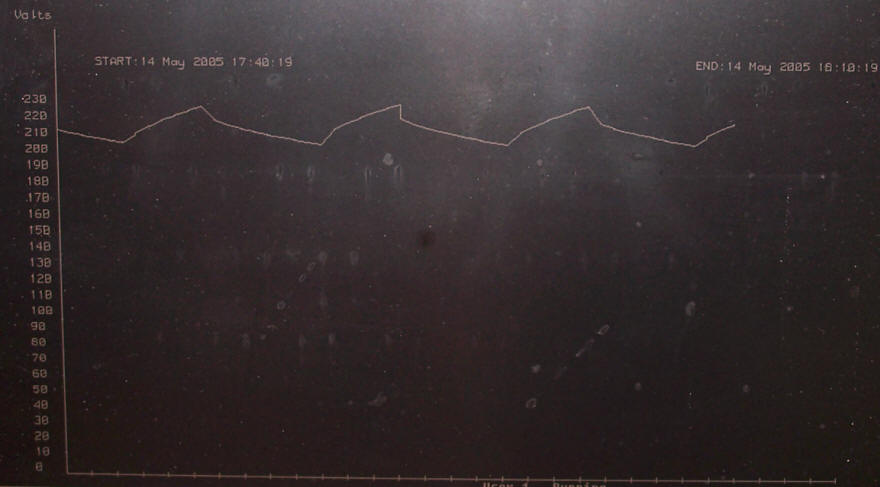
2.4KW for 30minutes, and here's the duty cycle raw data:
ON 17:43:47, OFF 17:46:40, ON 17:50:54, OFF 17:53:47
I also noted that for the final two tests, not only did the car engine come on, but the electric engine cooling fan operated intermittently while the engine was charging the battery.
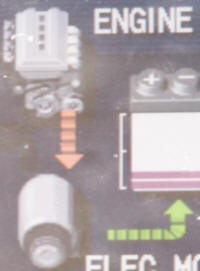
At the beginning of each day's tests, the battery was "fully" charged, i.e., it was typically reading 6 bars (blue) or 7 bars (green). As soon as testing got under way, the battery would discharge to two bars.
 |
 |
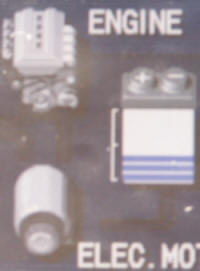 |
| Two bars-engine comes on | Three bars, engine soon shuts off | Three bars, engine now off. |
No jokes about extension cords. I'm disconnecting it now.
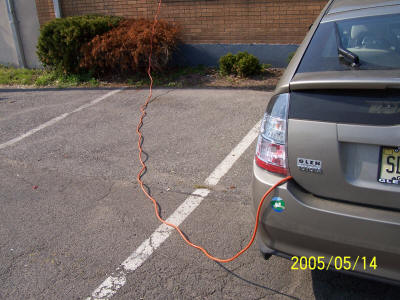
Thus concludes this round of tests. See the summary and conclusion for info on what this all seems to mean.