RIKLBLOG
|
| Tomorrow |
| 18 July 2008 |
| Yesterday |
| Index |
| Eventide |
| SETI League |
| PriUPS Project |
| Bonus! |
| Contact |


Fluctuations
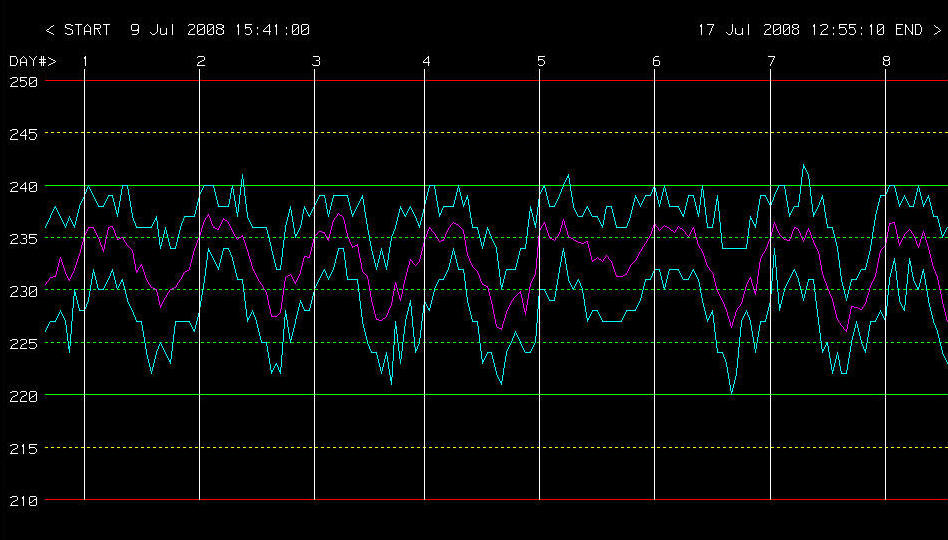
(Click on image to see full week)
This blogitem started out as a quick question from someone who lives near me: How high and low does our AC voltage get. Despite the fact that I have been monitoring my AC voltage for several years, I admitted that I wasn't sure. Never one to let a geeky question go unstudied, I modified my PriUPS monitoring program to help provide an answer.
The PriUPS program samples the AC voltage, the UPS power output, and the UPS battery voltage every ten seconds. Of course it also monitors the Prius battery voltage when the car is connected. To save disk space and present the data in a useful fashion, my program graphs the data and, hourly, saves only the graphs, not the raw data. To get a useful reading on line voltage fluctuations without saving every point, I modified the program to output the maximum and minimum peaks, as well as the average, once per hour. The graph above shows a few days of this activity (click on it for a full week). The magenta line is the average voltage, and the blue lines are the highest and lowest voltages recorded during the hourly intervals.
I'm tempted to stop here. That would leave you with the question: "So what?" But instead, I'll offer a bit of interpretation, which will postpone the "So what?" for a paragraph or so.
The first thing you notice, after two days, is that there seems to be a repetitive aspect to this. The vertical day number lines are approximately midnight, so you can see that the voltage is highest in the early morning hours, dips quite a bit as the day wears on, and then increases as it starts getting late in the evening. None of this is a surprise. It being July, it gets hotter later in the day, and the air conditioners demand more and more power, probably peaking as people get home and want to cool off the house. Air conditioners are the biggest power consumer at my house, and probably at yours as well.
The next thing I found interesting is that the power company seems pretty good at keeping within the limits of 220 to 240V. This was my friend's initial concern since both high and low voltages can damage equipment that is plugged into the power line. This past week has been one of benign weather and no extreme temperatures, so it's no great surprise that with only tiny exceptions the voltage has been appropriate.
If I believed that the graph would remain this predictable indefinitely I could stop taking the data now. But it won't and I won't because taking the data requires no effort and essentially no storage capacity, and I have little doubt that I'll "catch" the utility in some awesome item of lush malfeasance in due course. At which point you just know I'll have a full report.
Power Loss and Plug-In Hybrids
The graph is instructive in a couple of ways not related to the precise data, but rather to its shape. The first is that we are wasting a lot of electricity. And by "we" I'm not referring to power utility clients, but rather to the whole power distribution system. There's no great challenge to regulating the output of a power plant. I'm sure if you measured the voltage at the generator's substation it would be a lot more steady and a lot closer to 240V. The fluctuations you see at home (I measure the voltage after the utility meter, but before it is actually distributed in the house) are caused by line losses. The dips in voltage in the afternoon correspond to power being dissipated in the distribution system, e.g., the wires, transformers, and other infrastructure. It's pretty efficient, but the loss depicted here, if considered on a national basis, would be enough to power two or three average-size states! (Assuming the power company is sending me 240V and I'm receiving 227 in late afternoon, that's 2.7% loss. In fact it's worse than that, since I see only local losses. One estimate indicates total grid losses at around 7%.)
Looking at late-hour voltages, you can see why we're told to charge our plug-in hybrids at night. The amount of power needed to run a car is not all that different from the power needed to run a house. Until the market penetration of these vehicles is very high, there will be plenty of capacity to charge them. As they become successful, you can expect the magenta line to start flattening. When it starts to invert, though, we will be in for trouble if we don't have more power plants available.
| Special Advertising Section | ||
 |
Please buy one or both of these lovely blue cars! The
Corvette ZR1 is on
the left, the
Mitsubishi 3000GT VR4 is on the right.
Thank you. |
 |
NP: "Between You And Me" - Marillion
| © 2008 |
| Richard Factor |